Your dashboard provides an at-a-glance look at the success of your marketing tools. This includes the number of communications sent out, how your clients responded, and an estimate of the revenue returned by your marketing efforts.
Click here to download our one-page guide on understanding your dashboard.
Before you start
- This feature is only available with certain software packages. For more information on what your subscription includes, click here.
- Access to the dashboard is restricted to the owner login.
Accessing your dashboard
To start, log in to your MINDBODY site and then:
- Go to the Marketing tab, click Manage to the right of Email campaigns or Automations, and select Open more tools on the left side.
- Select Dashboard on the left.

Understanding your dashboard
Performance tiles
The tiles at the top of the screen show how well your campaigns have performed over the past month. Because each figure is drawn from the Marketing Suite's built-in reports, you can click on a tile to see the stats in greater detail.
Please note that the image shown below is just an example, and your dashboard may show different tiles depending on the specific tools you use at your business.

Possible tiles include:
- New Appointments: The number of appointments that were booked by a client as a result of receiving a marketing communication from the Marketing Suite.
- Estimated Revenue: The estimated revenue that can be attributed to the Marketing Suite's marketing campaigns. Estimated revenue takes into account the standard pricing of the service booked and any discounts applied, if known.
- Rescued Clients: These are clients that have become dormant but have reengaged with your business as a result of the Marketing Suite's marketing campaigns.
- New Text Opt-ins: This number shows the customers that have specifically opted in to receiving texts for promotional purposes.
- Leads Captured: Number of leads captured by your Packages & Memberships campaign if you've activated it.
- Referral Offers Shared/Claimed/Booked: A quick peek into how your referral program is going.
- Email Opens: The number of clients who opened an email after it was sent.
- Email/Text Interactions: The number of clients who clicked a link or otherwise interacted with a campaign after opening the email or text.
- Net Promoter Score© (NPS): This reflects the percent of customers who have given you a rating of 9 or 10 minus the percent of customers who have given you a rating of 6 or lower.
- Feedback Responses: This is the number of feedback responses that your business has received.
Interactions pie chart
The pie chart digs into the success of your campaigns by showing how clients interact with your business after opening a text or email.
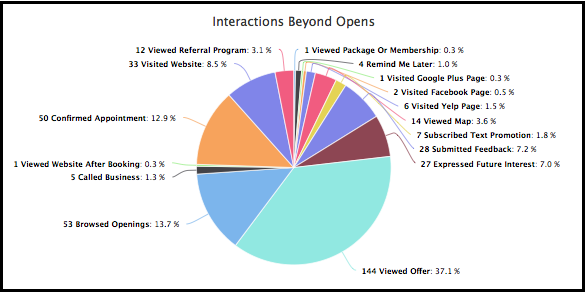
Here are just some of the interactions shown:
- Expressed future interest
- Clicked through to view the offer details
- Subscribed to text promotions
- Asked to be reminded to book later
- Called your business after receiving a campaign
- Confirmed an appointment after receiving a reminder
Communications graph
The graph at the bottom of the dashboard show the ebb and flow of communications sent by your business. The green bar represents emails sent while the blue bar represents text messages.
Back to top